Data Mining & Exploration
We make science discovery happen
Sky Transient Discovery Web Application

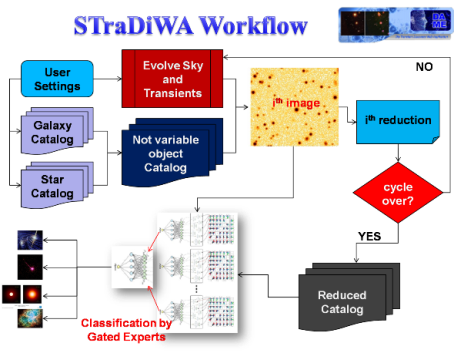
This page is the entry point to the STraDiWA Web Application (under design) specialized for data mining on astronomical images. It is a service of DAME Program to detect variable objects from real or simulated images. It includes also an automatic workflow to generate astronomical images with a user-defined number and type of variable objects, in order to perform setup and calibration of classification models running on the real images coming from observations. In this page the users can obtain news, documentation and technical support about the web application.
The Strategy
Scope of the following project is to provide a scientific workflow to implement a set of tools for the detection and classification of photometric transients in multiband, multi-epoch surveys. Classification (in terms of probability density function) needs to be fast, in order to trigger possible follow-ups.
Summary of steps:
- Check for existing stuff;
- Define set of rules for most significant variable object models;
- Search for algorithms able to work on transients;
- Define a strategy to evaluate their performances in a realistic framework (i.e. simulations);
- Implement within DAME the simulation package;
- Evaluate and test classification algorithms on simulated data;
- Implement selected algorithms on real pipeline;
This project is directly connected with the KDD-IG, the Interest Group for data mining established within the IVOA Consortium.
Finally, the participation is intended to be extended to externals collaborators, to improve science expertise and background on variable object modeling and to gain the possibility to test the workflow on real new generation survey pipelines. The evaluation of classifiers requires benchmarks, hence reference templates. At the moment, these templates are not available. The usage of existing data (cf. PQ survey, etc.) does not solve all problems due to: high threshold for detection (which rules out many variable objects), incomplete classification of most variable objects.
In our opinion, the best way to obtain these templates is to provide a realistic sky simulation framework. These realistic simulations should take into account as many as possible relevant factors (except the random presence of artifacts which, however, could be inserted at a later stage). In particular:
- Instrumental realistic setup (telescope scale and mounting, S/N ratio, band, instrument features, optical design and optimization, residual aberrations, wavefront sensing, site environment and seeing parameters, etc.);
- Survey strategy (how many bands, how deep). For details please consult the documents below;
- Sampling mode (even, uneven, realistic, i.e. taken from existing surveys) and rate (how frequently is the same region of the sky observed in each band);
- Realistic distribution of pre-modeled variable objects (from the list of objects defined in the following);
By having this simulation framework available, a set of synthetic multi-band and multi-epoch sky images can be obtained.
The second step of the workflow should hence be based on the analysis and implementation of data mining algorithms, deployed on the DAME Cloud/GRID platforms already available, that could perform detection and classification of such variable objects on the simulated images. The final step should foresee the test of the best DM algorithms on real cases, i.e. next generation telescope and focal plane instrument survey pipelines, in order to evaluate the selected DM models in a realistic and operational environment.
User Documentation Package
- STraDiWA: A simulation Environment for Transient Discovery, M. Annunziatella, Astrophysical Colloquium at Astromeeting, OAC Naples, June 20, 2012
- Brescia M., Annunziatella M., Cavuoti S., Longo G., Mercurio A., STraDiWA Project Overview, DAME Technical Documentation, code DAME-DOC-NA-0003-Rel1.0;
- Simulating the LSST Survey;
- Stuff 1.19;
- Skymaker 3.3.3;
- Ontology of Astronomical Object Types, Version 1.3, IVOA Technical Note 17 January 2010 available here;
- Astromatic: pipeline software available here;
The Simulation Environment
As mentioned before, there is available a software package for simulations of sky patches and instrumentation FOV response. We started to analyze in details the packages Stuff and SkyMaker. In both cases, their internal mechanism is quiet simple. They require to configure specific setup files in order to specify the correct sky, instrument and observation site features for the current simulation.
In particular, in Stuff, after adding star objects, the main specification to simulate a variable object is to introduce a realistic (i.e. obtained through the set of rules discussed below) change in magnitude. Hence, one of the main tasks of the variable object modeling is to identify a pseudo-analytical function (i.e. a look-up table) of the variation of magnitude with time, for each kind of objects: by giving as input a magnitude, a phase and a time, the pseudo-analytical function should return the changed magnitude (the beginning of the phenomena could be randomly generated). It can be also taken into account an overlap effect, induced by Stuff that works on centroids, together with transient effects on bulge and disk axes. We verified also that it is possible to generate extended objects with SkyMaker.
By analyzing several releases of Stuff and SkyMaker, slight variations are present, that , however, do not seem to affect our final result. A special effort should be spent on the right integration of optical aberrations into the original software, depending on the specific telescope and instrument modeled in the simulation. By executing in sequence Stuff and SkyMaker, configured with setup files reported in the previous sections of this appendix, the output image, representing a simulated sky patch in the B band, obtained is showed in fig. 1 below. All scientific details about the image are addressed in the setup files.
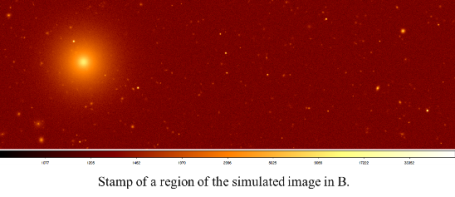
Sky simulation for 5 variable objects (3 cepheids + 2 irregular variable objects) in the B,V,I bands. The instrument parameters are referred to the VLT Survey telescope (VST):
- Mag: 18 - 26.0
- Pixel Size: 0.213 arcsec
- Exp Time: 1500.0(s)
- Seeing: 0.7 - 1.2
- Image Size: 1024x1024
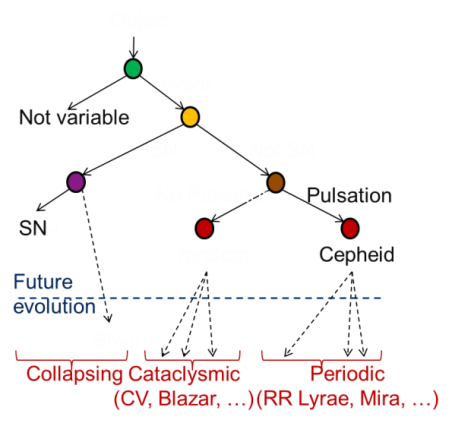
First approach is to use light curves to separate different groups of classes. We propose to find which is the best classifier for a particular type of variable object. The evaluation of classifiers requires benchmarks, hence reference template images (or catalogues) on which to test the various models, organized in hierarchical classification tree, as shown below.
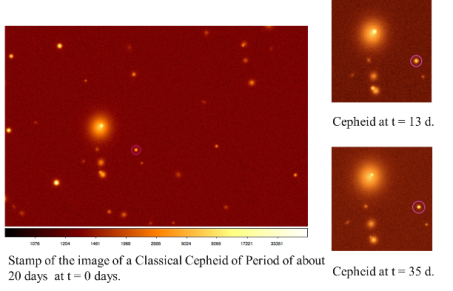
As an example, we show below a cepheid and a SN-Ia, as obtained by our simulation in a VST instrument setup case.
A classical Cepheid is modeled:
- Assuming a sinusoidal law.
- Imposing a PL luminosity relation.
- We used the coefficients for the mean PL relation calibrated in Bono et al. 2010 and references therein.
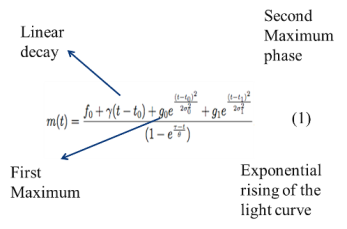
A classical SN-Ia is modeled:
- using an analytical function, used in Contardo, Leibundgut, and Vacca 2000 for the fit of a sample of type Ia Supenovae.

The Classification Algorithms
This is the section related with the DM methods and algorithms to be explored in order to perform the required detection and classification of variable objects. We are currently at the very beginning of this phase. It requires a preliminary review of all existing algorithms which could be relevant to the classification in real time of transients. For instance:
- Bayesian Networks;
- Random Forest;
- Supervised classifiers trained on simulations;
- Unsupervised clustering and detection methods;
The application of such methods could also arise from the analysis of algorithms and applications already available in the DAME Cloud framework. At the moment, these are listed in the following table:
MODEL |
CATEGORY |
FUNCTIONALITY |
MLP + Quasi Newton learning rule |
Supervised |
Classification, Regression |
MLP with GA learning rule |
Supervised |
Classification, Regression |
Support Vector Machine (SVM) |
Supervised |
Classification, Regression |
Multilayer Clustering (Self Organizing Maps - SOM) |
Unsupervised |
Clustering |
hybrid |
Feature Selection, Classification, Regression |
|
Unsupervised |
Dimensional reduction, pre-clustering |
Tab. 1 – data mining models in DAMEWARE, foreseen for experiments
In the following we report a first classification experiment with MLPQNA
The images used for the experiment were simulated using the characteristic of the VST optics, and the using a quarter of the size of the camera. We used an exposure time of 1500s and set the magnitude limits between 14 and 26 magnitude and the seeing at 0.7, an average value in Cerro Paranal. All the following is referred to a johnson/B image.
The two tables below report the simulation setup for two experiments, where the main difference is the grown statistical sample in the second simulation, in order to verify, as expected, if the MLPQNA classifier is able to enhance its learning capability when the number of training sample is much larger.
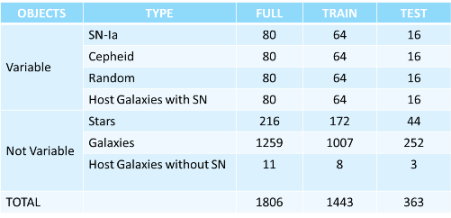
Simulation 1 Summary Table
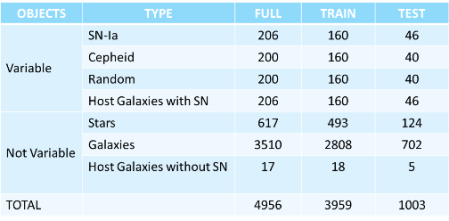
Simulation 2 Summary Table
In order to evaluate and compare the classification results, we have selected 3 evaluation criteria, summarized in the following picture.

With such criteria, the classification results, related to the two simulations, are shown in the table below.

As theoretically foreseen, when the training sample is larger (SIM2), the classifier is able to obtain an higher accuracy and purity. The slight grown of contamination is also expected, due to the larger statistical sample in the SIM2, but it is quite smaller than the gain in terms of purity.
Further methods, after the decision to be employed in this project, will be implemented in the DAME package.
Items to discuss:
- Sampling provides important a priori constrains to be fed to classification algorithms (reverse engineering of paper by Madore 1985) (objects which can and cannot be detected);
F.A.Q.
- How can I have the access to the web application?
- The web application is available here
