Data Mining & Exploration
We make science discovery happen
Photometric redshift Estimation

Photometric redshift estimation is a method to evaluate object distances when spectroscopic estimates become impossible due either to poor signal-to-noise ratio, to instrumental systematics, or to the fact that the objects under study are beyond the spectroscopic limit. Given the high complexity of the photo-z approach and the multiple factors that influence the results, it is reasonable to test the photo-z codes on real photometric data of objects that have also been observed spectroscopically for precise redshift measurements. The following described experiments have been approached by DAME Team with Machine Learning methods, revealing high quality performance and robustness.
DR9 - SDSS galaxy photometric redshifts
Related published article is Brescia et al. 2014, A&A
![]() The photometric redshift catalog of more than 130 million of galaxies is made available through CDS facilities, described HERE
The photometric redshift catalog of more than 130 million of galaxies is made available through CDS facilities, described HERE
Accurate photometric redshifts for large samples of galaxies are among the main products of modern multiband digital surveys. Over the last decade, the Sloan Digital Sky Survey (SDSS) has become a sort of benchmark against which to test the various methods. We present an application of a new machine learning based method to the estimation of photometric redshifts for the galaxies in the SDSS Data Release 9 (SDSS-DR9). Photometric redshifts for more than 140 million galaxies were produced and made available at CDS.
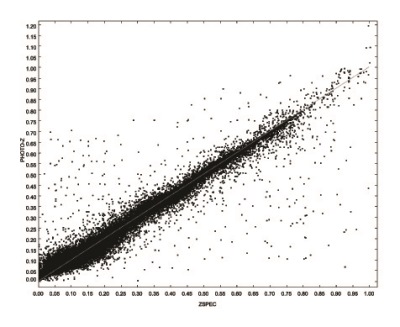
The MLPQNA (Multi Layer Perceptron with Quasi Newton Algorithm) model provided within the framework of the DAMEWARE (DAta Mining and Exploration Web Application REsource) is an interpolative method derived from machine learning models, which is capable to effectively deal with complex data. The obtained redshifts have a very low bias of about 3x10^-5 and a normalized standard deviation = 0.023, (i.e. a total overall uncertainty of about 0.024), which decreases to 0.017 after the rejection of catastrophic outliers, which are about 5%. This result is better or comparable with what was already available in the literature but present a smaller number of catastrophic outliers.

PhotoRApToR (PHOTOmetric Research APplication To Redshifts)
The many ongoing and planned photometric surveys produce huge datasets that would not be analyzed without the data mining methods deriving from the emerging field of Astroinformatics. The problem is that a great part of astronomical data is stored in private archives that are not accessible on line. So, in order to evaluate photo-z it is needed a desktop application that can be used by everyone on its own personal computer. The name chosen for this application was PhotoRApToR, i.e. Photometric Research Application To Redshift. Behind such client desktop application there is a neural network, namely the MLPQNA (Multi Layer Perceptron implemented with a learning rule based on the Quasi Newton Algorithm).
A Multi-Layer Perceptron may be represented by an input layer, with a number of perceptrons equal to the number of input variables, an output layer, with as many neurons as the output variables; the network may have an arbitrary number of hidden layers (in most cases one) which in turn may have an arbitrary number of perceptrons. In a fully connected feed-forward network each node of a layer is connected to all nodes in the adjacent layers representing an adaptive weight calculated on the strength of the synaptic connection between neurons. In order to find the model that best fits the data, one has to provide the network with a set of examples. In general Quasi Newton Algorithms (QNA) are variable metric methods used to find local maxima and minima of functions and, in the case of MLPs they can be used to find the stationary (i.e. the zero gradient) point of the learning function. QNA are based on Newton's method to find the stationary point of a function, where the gradient is 0. The Hessian matrix of second derivatives of the function to be minimized does not need to be computed, but is updated by analyzing successive gradient vectors instead.
![]() package for Linux Ubuntu (64 bit)
package for Linux Ubuntu (64 bit)![]() package for Scientific Linux 6 (64 bit)
package for Scientific Linux 6 (64 bit)![]() package for MS Windows 10 (64 bit)
package for MS Windows 10 (64 bit)![]() package for MS Windows 7 (generic platform)
package for MS Windows 7 (generic platform)![]() package for Apple Mac OSX Lion (10.7.5)
package for Apple Mac OSX Lion (10.7.5)![]() package for Apple Mac OSX Mavericks (10.9.2)
package for Apple Mac OSX Mavericks (10.9.2)

Photometric redshifts for Quasar in multi band surveys
Detailed information are in the ApJ paper
MLPQNA stands for Multi Layer Perceptron with Quasi Newton Algorithm and it is a machine learning method which can be used to cope with regression and classification problems on complex and massive data sets. In this work we present the results of its application to the evaluation of photometric redshifts for quasars. The data set used for the experiment was obtained by merging four different surveys (SDSS, GALEX, UKIDSS and WISE), thus covering a wide range of wavelengths from the UV to the mid-infrared. The method is able i) to achieve a very high accuracy; ii) to drastically reduce the number of outliers and catastrophic objects; iii) to discriminate among parameters (or features) on the basis of their significance, so that the number of features used for training and analysis can be optimized in order to reduce both the computational demands and the effects of degeneracy. The best experiment, which makes use of a selected combination of parameters drawn from the four surveys, leads, in terms of Deltaz (i.e. (zspec - zphot) / (1 + zspec)), to an average of Deltaz = 0.004, a standard deviation sigma = 0.069 and a Median Absolute Deviation MAD = 0.02 over the whole redshift range (i.e. zspec <= 3.6), defined by the 4-survey cross-matched spectroscopic sample. The fraction of catastrophic outliers, i.e. of objects with photo-z deviating more than 2sigma from the spectroscopic value is < 3%, leading to a sigma = 0.035 after their removal, over the same redshift range. The method is made available to the community through the DAMEWARE web application.
The sample of quasars, used in the experiments described in this paper, is based on the spectroscopically selected quasars from the SDSS-DR7 database (table Star of the SDSS database). The resulting number of objects in the datasets used for the experiments are:
- SDSS: ~ 1.1 x 10^5;
- SDSS + GALEX: ~ 4.5 x 10^4;
- SDSS + UKIDSS: ~ 3.1 x 10^4;
- SDSS + GALEX + UKIDSS: ~ 1.5 x 10^4;
- SDSS + GALEX + UKIDSS + WISE: ~ 1.4 x 10^4;
Finally, in producing training and test sets we made sure that they had compatible spectroscopic redshifts distributions (see figure below).

The output of the experiments consisted of lists of photometric redshift estimates for all objects in the Knowledge Base (KB). All pruning experiments were performed using ~ 3000 objects in the training set and ~ 800 in the test set. In the following table, we list the outcome of the experiments for the feature selection. Both bias(Deltaz) and sigma(Deltaz) were computed using the objects in the test set alone. As it can be seen, among the various types of magnitudes available for GALEX and UKIDSS, the best combination is obtained using the isophotal magnitudes for GALEX and the calibrated magnitudes (HallMag) for UKIDSS. Therefore at the end of the pruning phase the best combination of features turned out to be: the five SDSS psfMag, the two isophotal magnitudes of GALEX, the four HallMag for UKIDSS and the four magnitudes for WISE.

PHAT (PHoto-z Accuracy Testing)
The PHAT (Hildebrandt et al. 2010) consists of a competition engaged by involving several worldwide groups with the aim at evaluate different (theoretical/empirical) methods to extract photo-z from an ensemble of ground-based and space observation catalogues in several bands, composed to perform photometric redshift prediction evaluation tests of several models, both theoretical and empirical, based on the training/statistics of given spectroscopic redshifts.
The imaging dataset is obtained basically on the GOODS-North (Great Observatories Origins Deep Survey Northern field), as presented in Giavalisco et al. 2004.
The photometry used is partially obtained from Capak et al. 2004 and other sources, which includes several bands.
The total features of object patterns are indeed based on 18 bands. In particular the IRAC bands are matched with the photometry of Capak et al. 2004 using 1 arcsec of matching radius. Following practice, the SExtractor MAG_AUTO magnitudes were used for ACS data, while the aperture corrected 3.6 arcsec diameter aperture magnitudes were used for IRAC.
The resulting photometric catalogue is matched to different spectroscopic catalogues from the following sources:
The above sources yield a dataset (shown below), with a total of 1984 objects with 18-band photometry and spectroscopic redshifts.

Some DAME Team members (S. Cavuoti, M. Brescia, G. Longo and A. Mercurio), decided to participate to the PHAT competition, by using the MLPQNA (Multi Layer Perceptron trained by Quasi Newton learning rule) model.
An example of training and test data sets (including our best results) used in our experiments are available for public download: TRAINSET, TESTSET, RUNSET.
It is also available the Complete catalogue table in editable version (CSV format).
Main results are also summarized below.
As known, supervised machine learning models are powerful methods able to learn by training data the hidden information correlation between input and output features (parameters of the data set). Of course their generalization and prediction capabilities strongly depend by the intrinsic quality of data (signal-to-noise ratio), level of correlation inside of the PS and not least by the quantity of missing information inside the data set.
Among these affecting factors the most relevant is the fact that most ML methods are quite sensitive about the presence of NaN (not a number) in the data set to be analysed.
The presence of features with a large fraction of NaN can seriously affect the performances of a given model and lower the accuracy or the generalization capabilities of a specific model.
It is therefore a good praxis to analyze the performances of a specific model in presence of features with large fractions of NaN. This procedure is strictly related to the so called feature selection or pruning of the features phase which consists in evaluating the significance of individual features to the solution of a specific problem. We summarized the experiment outcome of the pruning performed on the PHAT1 dataset in the table downloadable here.
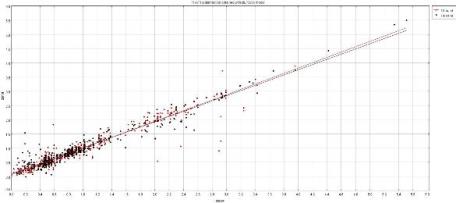
There are two plots below, showing photo-z vs. spec-z for the 18- and 14-band cases, respectively. You can compare those to figures 12 & 14 of the PHAT paper.
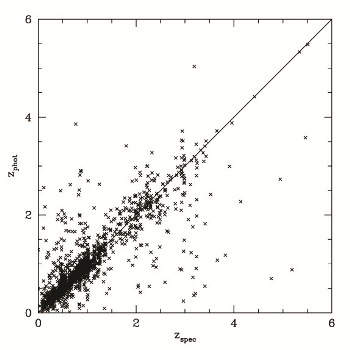
18-bands experiment statistics: 324 outliers with Delta_z>0.15 (16.3306 %); 1660 objects with z-stats: 0.000604251 +/- 0.0562278
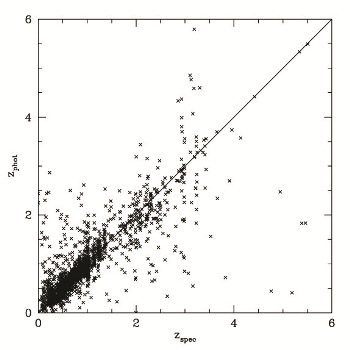
14-bands experiment statistics: 384 outliers with Delta_z>0.15 (19.3548 %); 1600 objects with z-stats: 0.00277721 +/- 0.0626341
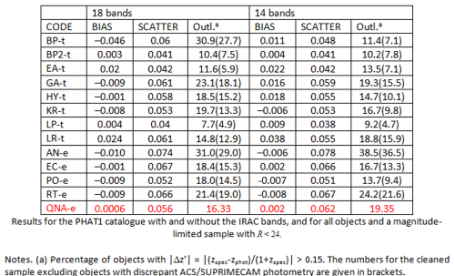
The following table reports the comparison among different methods used by all participants to the PHAT experiment. The red one is our MLPQNA test.
The following image reports the zspec-zphot distribution for the final catalogue (black 14-band and red 18-band) as obtained by MLPQNA regression experiments
Download here the complete catalogue table (PDF format) and the editable version (CSV format)
